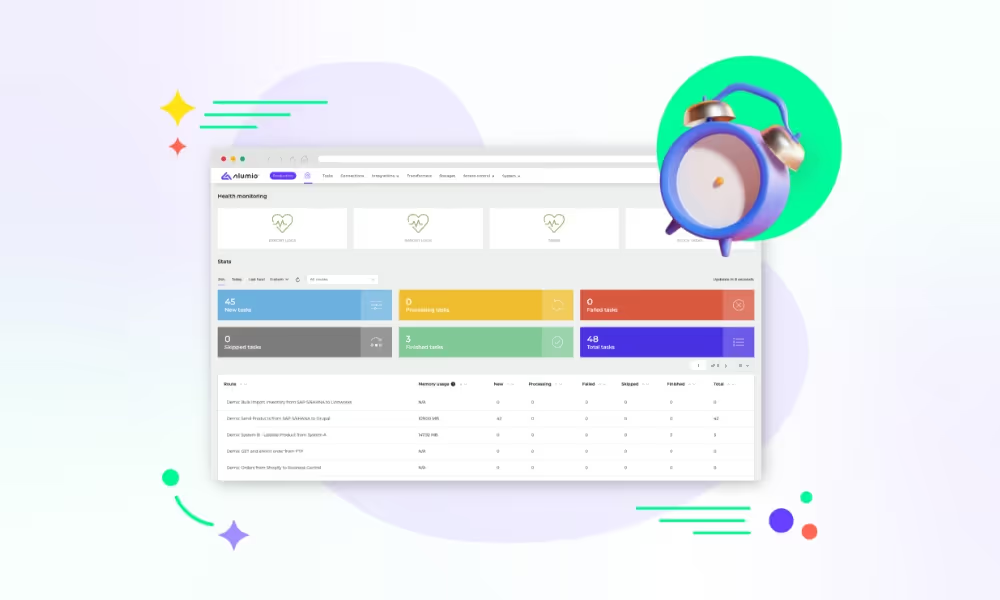
Introducing the Alumio Route Builder
Now connect, orchestrate, and govern integrations at scale from one visual interface

The cost a Sage X3 site works out for itself reaches Microsoft Power BI with that site attached to it, so a group figure is built out of things that were actually measured in the same way.


























A business running Sage X3 across several sites is running several setups. Each site has its own structures, its own conventions and often its own history of how a figure came to be calculated that way, which is exactly what a multi-site system is for. It becomes a problem the moment somebody adds two of those figures together in a report and presents the total as a fact. Connecting Sage X3 and Microsoft Power BI makes the site part of the figure rather than a footnote, so a total is built from comparable things and a difference between two plants is a real difference rather than a difference in method.
DATA THAT FLOWS BETWEEN THEM
Site records
Cost elements
Production orders
Stock valuations
Sales figures
Period balances


Sage X3 figures reach Microsoft Power BI carrying the site that produced them, so a total can be broken back down and a plant is never compared against a group average by accident.
Cost elements are aligned on the way through, so a Microsoft Power BI report adds figures that were measured the same way rather than numbers that only share a name.
When two Sage X3 sites report differently, the gap shows in Microsoft Power BI as something to investigate rather than being hidden inside a group figure nobody questions.
Bringing another Sage X3 site into Microsoft Power BI extends the existing alignment rather than starting again, so opening a plant does not mean rebuilding the reporting.
Alumio reads production and cost figures per Sage X3 site, aligns the elements each uses, and delivers them to Microsoft Power BI, so an operations director compares two plants on one basis rather than two locally sensible ones.
Period balances from every Sage X3 site arrive with their site and their element mapping applied, so a consolidated Microsoft Power BI figure survives being questioned and can be traced back to the places it came from.
Stock valuations reach Microsoft Power BI per site and per element, so the value held across the business is visible without somebody first establishing whether two sites mean the same thing by the word they both use.
Alumio sits between sales channels and fulfillment systems as a governed integration backbone. Orders are routed, transformed, and validated, while status updates return to every channel.

Authenticate your systems using Alumio's pre-built connectors. Choose from 200+ connector packages in the marketplace, plus unlimited custom integrations.

Define how data fields map between systems in a visual interface. Adjust formats, enrich records, and apply business logic, no custom code required.

Configure flows to run in real time on events, on a schedule, or both. Reduce manual data entry and let Alumio handle movement and transformation between systems.
.svg)
Once your first integration is live, adding your ERP, PIM, WMS, or CRM connects to the same hub. Existing flows keep running. No rebuilding from scratch.

If nothing else is ever connected, the reports still stop short of what people ask about, because Sage X3 knows when goods left and not when they arrived. The transport system holds the second half, and delivery performance is the question that follows almost every cost conversation. Alumio holds that connection alongside this one, so a Microsoft Power BI view can show what a site made and what it managed to deliver.
Yes, with the per-site alignment applied in transit rather than afterwards. Alumio reads the Sage X3 cost elements, balances and production figures you nominate for each site, maps them onto the shared set the business reports on, and delivers the result for Microsoft Power BI to read. Doing it before the data lands is what stops each report inventing its own version of the same element.
No, this is configured rather than coded. The job it removes is the monthly round of asking each Sage X3 site controller for their figures in an agreed layout, then reconciling the ones that arrive in a different one. Element mappings per site become entries in Alumio, and Microsoft Power BI reads the aligned result. Where a site's structure has to be derived rather than read across, the Code Transformer carries that inside the same flow.
The site's own, until somebody decides otherwise, and that decision is the work. Sage X3 lets each site hold its own structures, which is why it suits a multi-plant business, and it also means two figures with the same label can include different things. Agreeing what the group element means, then mapping each site onto it on the way to Microsoft Power BI, is what turns a total into something an operations director can act on.
Two sites that measured in different units and a total that added them anyway is the failure to catch, because the report is perfectly formed and quietly wrong. Alumio watches each delivery live and records the Sage X3 site and the conversion it applied, so a figure that will not align raises an alert naming the site and the element before Microsoft Power BI reads it. Retries run where configured, so nothing enters a report unconverted.
Talk to an Alumio integration specialist. We'll map the right architecture for your systems, at the right scale, so your operations stay reliable through every change.















.svg)


