Connect every production event to the systems that need to act on it

Explore manufacturing integrations
A Alumio vivid purple arrow pointing to the right, a visual representation of how to access more page material when clicking on it.
Go back

How to make production monitoring real-time

By
Saad Merchant
Published on
May 29, 2026
Updated on
June 1, 2026
IN CONVERSATION WITH
Email icon
Email icon

Most production monitoring dashboards in manufacturing don't actually show real-time data. They show data that was real at the last polling interval, aggregated by the last batch job, and routed through whichever ERP report was scheduled to run overnight. By the time the plant manager looks at the screen, the information is anywhere from fifteen minutes to a full shift behind. That gap is the difference between catching a problem while a line is running and discovering it during the shift handover. Real-time production monitoring is what fills that gap, but the dashboard is the last thing to build, not the first. The architecture underneath, including event-driven data flows from PLCs and SCADA, computed OEE metrics, and exception-based alerting, is what actually makes the monitoring real-time. An integration platform is what ties those flows together into a working pipeline. Manufacturers building real-time production monitoring today are working from polling-era foundations toward an event-driven layer, and the design decisions made early shape what's possible later.

Why most production monitoring dashboards aren't actually real-time

The conversation around production monitoring tends to fixate on dashboards. Which KPI visualization tool, which OEE template, which screens go on the plant floor. Those choices are real, but they sit on top of decisions made one layer down that determine whether the dashboards show useful information or stale numbers wearing a fresh interface.

The architectural decision worth making first is how production data flows from the shop floor into the systems that consume it. Most existing setups use polling: dashboards or aggregators that ask SCADA, MES, or ERP for current state at scheduled intervals. Polling works when the production pace is measured in shifts. It breaks when the production pace is measured in cycles per minute, which describes most modern manufacturing operations. Real-time production monitoring needs event-driven data flows underneath, with the dashboard as the visible top layer rather than the primary engineering investment.

Why do most production monitoring dashboards show stale data?

Most production monitoring dashboards show stale data because the data pipeline behind them was built for batch reporting, not for real-time observation. The pipeline runs roughly like this: PLCs and machine controllers generate operational data, SCADA aggregates it locally, MES pulls from SCADA on a schedule, ERP receives MES data through nightly or hourly batches, and the BI dashboard pulls from ERP. By the time the dashboard refreshes, the data has passed through three or four systems, each with its own update cycle.

This architecture made sense when production reporting was a daily exercise. It doesn't fit the current expectation that managers should see what's happening on the line within seconds, not at the next refresh cycle.

The hidden cost is decision lag. A line stoppage at 9:14 AM that propagates through the data layer doesn't reach the dashboard until 9:30 or later, depending on which batch cycles it crosses. By the time someone looks, the line has either restarted or run out the rest of the shift on degraded output. The dashboard becomes a historical record of what happened, not a decision support tool for what's happening.

What does real-time production monitoring actually require?

Real-time production monitoring requires four things from the data layer underneath: event-driven flows from the OT layer, computed metrics close to the source, exception-based alerting, and observability across the whole pipeline.

The four requirements:

  • Event-driven data flows: Machine state changes, cycle completions, anomalies, and faults broadcast as events the moment they happen, rather than waiting for the next polling cycle
  • Computed metrics at the edge or in the integration layer: OEE, throughput, yield, and quality metrics calculated as the data flows rather than aggregated after the fact in BI tools
  • Exception-based alerting: notifications triggered by deviations from expected state, sent to the systems and people who can act on them, instead of dashboards waiting to be checked
  • Observability across the pipeline: trace-back capability when the dashboard shows something unexpected, so the team can quickly verify whether the issue is on the line or in the data flow

These four requirements together change the dashboard's role. Instead of being the primary monitoring tool, it becomes the visible summary of an event-driven layer that's already doing the monitoring work continuously.

How an integration platform supports real-time production monitoring

An integration platform-as-a-service (iPaaS) handles the event-driven connectivity, transformation, and observability that real-time production monitoring depends on. Rather than building one-off bridges between each OT system and each downstream consumer, an iPaaS centralizes the integration layer and routes events across the production stack.

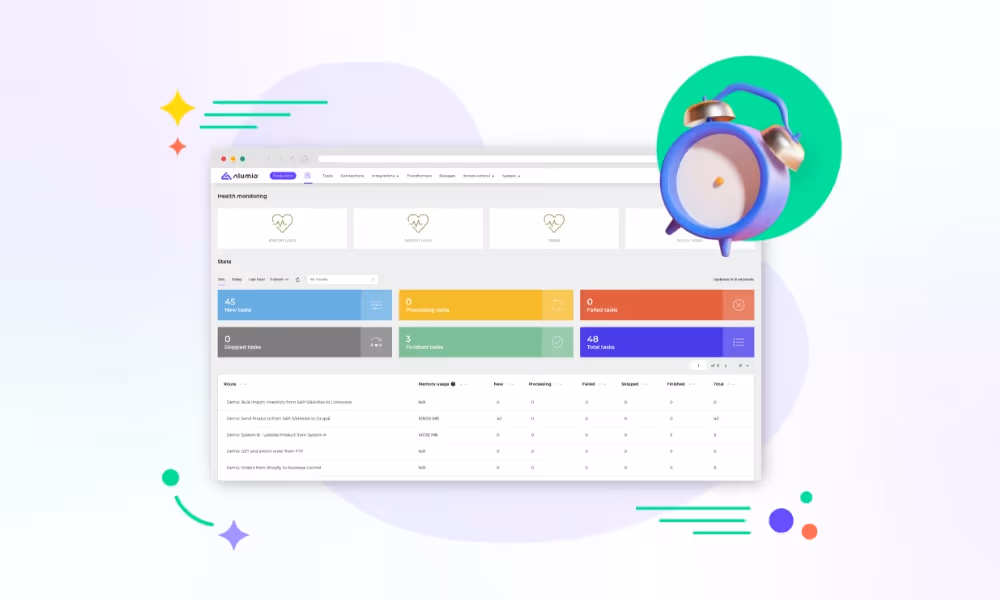
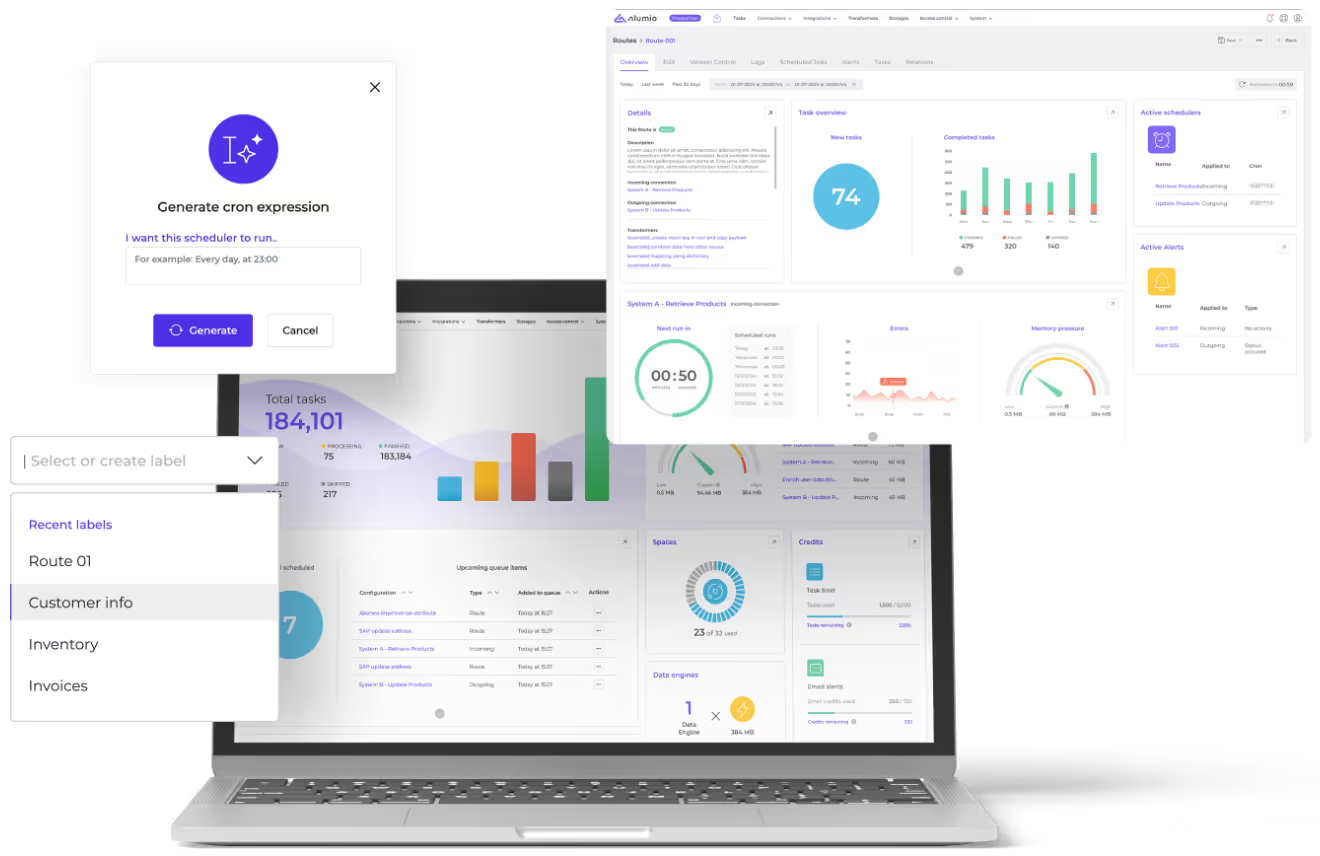
The Alumio iPaaS supports this pattern by bridging the OT and IT layers that hold production data. On the OT side, it connects to industrial gateways, sensor brokers, and unified namespace layers. On the IT side, it connects to MES, ERP, BI tools, and asset management systems. Routes orchestrate event-driven flows so production events propagate in seconds rather than overnight. Transformers and Mappers compute OEE, throughput, and yield metrics in the integration layer rather than waiting for downstream BI tools to aggregate them. The Inspection Tool provides observability across every event, so when something looks wrong on the dashboard, the team can trace back to the originating machine event.

The integration layer is where real-time monitoring stops being a dashboard project and becomes architecture. The dashboard renders what the integration layer produces, and the integration layer produces what the OT and IT systems generate as events. Each layer has a clear role, and the whole pipeline works at the pace the production floor demands.

This is the same integration foundation that connects machine data to enterprise systems in modern manufacturing operations. Real-time production monitoring is one of the use cases that becomes possible once that foundation is in place.

Turn AI ambition into action

Portrait of Leonie Becher Merli, Business Development Manager at Alumio

Get a free assessment of your integration needs and next steps

Portrait of Leonie Becher Merli, Business Development Manager at Alumio

Ready to move from polling-based dashboards to event-driven production monitoring?

Ready to move from polling-based dashboards to event-driven production monitoring?

Where to start with real-time production monitoring in an existing manufacturing stack

The starting point is one production line or one asset class where unplanned downtime carries clear cost and where the existing data flow is visibly inadequate. The line where the plant manager checks the screen and sees yesterday's numbers is the line where real-time monitoring delivers the most visible operational return.

The architectural decisions worth making early shape what becomes possible later:

  • Pick event-driven over polling from the start: even if the first iteration looks similar, the architecture is what compounds across additional lines and use cases
  • Compute metrics in the integration layer rather than in BI tools: the same OEE calculation should be consistent across every dashboard, report, and downstream consumer
  • Build observability before scale: diagnosing data issues across ten production lines is significantly harder than building observability into the first line from the start
  • Plan for ERP and MES alignment, not just dashboard display: the same event stream that feeds the dashboard should also reconcile with the production records in MES and the financial records in ERP

Most Alumio deployments in manufacturing happen through certified system integrators and digital agencies. That partner-led model matters in real-time production monitoring because the integration design has to reflect the specific PLC vintage, SCADA setup, and MES configuration each plant runs.

Real-time production monitoring is moving from dashboard project to architectural foundation

The next phase of manufacturing operations in 2026 and beyond runs on data that flows in seconds, not in shifts. The plants that already have event-driven production monitoring are making operational decisions while there's still time to influence the outcome. The plants still on polling-based dashboards are diagnosing yesterday's problems with today's data, and the gap between the two is widening.

The strategic shift worth absorbing is that real-time production monitoring is not a dashboard category, it is an architectural category. The dashboard is the visible summary. The architecture underneath is the actual investment, and it determines what every monitoring use case after the first one looks like. Event-driven flows replace batch-based reporting in this transition, with the integration platform as the layer where events get routed, transformed, and observed.

Manufacturers building real-time production monitoring today are making decisions that will shape their operational architecture for the next decade. The decision worth making early is to treat the integration layer as the foundation, not as the plumbing. The dashboards will follow naturally, and they will show what's actually happening on the line, not what happened the last time someone ran the batch job.

No items found.
Topics in this blog:
No items found.

FAQ

Integration Platform-ipaas-slider-right
What is real-time production monitoring?

Real-time production monitoring is the practice of observing manufacturing operations as they happen, with data flowing from the shop floor to dashboards, alerts, and downstream systems within seconds rather than minutes or hours. It combines event-driven data flows from PLCs and SCADA, computed metrics such as OEE and throughput, exception-based alerting, and observability across the production stack. The defining feature is that decisions can be made while the production line is still running, not after the shift has ended.

Integration Platform-ipaas-slider-right
What is event-driven architecture in manufacturing?

Event-driven architecture in manufacturing is a data flow pattern where significant occurrences on the production floor (a machine completing a cycle, a sensor anomaly, a quality threshold breach) are broadcast as events to all interested systems the moment they happen. This replaces the polling pattern where systems query each other on a schedule, most of which returns no new information. Event-driven flows reduce decision lag, eliminate redundant polling, and make real-time production monitoring possible.

Integration Platform-ipaas-slider-right
What KPIs does real-time production monitoring track?

Real-time production monitoring typically tracks OEE (Overall Equipment Effectiveness) and its components (availability, performance, quality), throughput per machine and per line, yield and scrap rates, cycle times, downtime by cause, and energy consumption. The exact KPI set depends on the production type and the operational priorities, but the common pattern is that each KPI is computed continuously from the underlying event stream rather than reconstructed after the fact from batch reports.

Integration Platform-ipaas-slider-right
How does an integration platform support real-time production monitoring?

An integration platform connects the OT systems generating production data with the IT systems consuming it, handling event-driven routing, data transformation, metric computation, and observability across the pipeline. It eliminates the one-off bridges that typically connect each OT source to each downstream system, replacing them with a centralized integration layer that scales across additional lines, assets, and use cases. Real-time production monitoring becomes a use case running on that foundation rather than a separate engineering project.

Integration Platform-ipaas-slider-right
Why are polling-based production dashboards considered out of date?

Polling-based production dashboards are considered out of date because they show data that was current at the last polling interval, which is typically minutes or longer behind real production state. The pattern wastes bandwidth and processing capacity on requests that return no new information, and it creates decision lag between when something happens on the line and when anyone can act on it. Event-driven dashboards refresh from the underlying event stream as events occur, which closes the gap.

Integration Platform-ipaas-slider-right
Should manufacturers build real-time production monitoring in-house or with a partner?

Most production monitoring projects benefit from partner-led delivery, particularly for manufacturers without prior event-driven architecture experience. Certified Alumio partners have deployed event-driven production monitoring across multiple plant configurations and bring patterns from real implementations, including OT connectivity, OEE computation rules, alerting thresholds, and observability design. The partner-led model is especially relevant for manufacturers planning to expand monitoring across multiple lines or facilities, because the architectural decisions made on the first deployment shape every deployment after it.

Get a free assessment of your integration needs

Laptop screen displaying the Alumio iPaaS dashboard, alongside pop-up windows for generating cron expressions, selecting labels and route overview.